Market Outlook
April 11, 2018
Market Cues
Domestic Indices
Chg (%)
(Pts)
(Close)
Indian markets are likely to open flat tracking global indices and SGX Nifty.
BSE Sensex
0.3
92
33,880
U.S. stocks moved sharply higher during the last trading session, adding to the
Nifty
0.2
23
10,402
modest gains posted in the previous session. The Dow Jones ended up by 1.8% to
Mid Cap
0.2
31
16,653
close at 24,408. The NASDAQ ended up by 2.1% to close at 7,094.
Small Cap
(0.0)
(4)
17,948
U.K. stocks were modestly higher after Chinese President Xi Jinping promised to
Bankex
0.9
262
28,368
lower import tariffs on products including cars and take other steps to further open
the world's second-largest economy, helping soothe investor jitters over an
Global Indices
Chg (%)
(Pts)
(Close)
escalating trade conflict with the United States. The FTSE 100 was up by 1.0% to end
at 7,267.
Dow Jones
1.8
429
24,408
Nasdaq
2.1
144
7,094
On domestic front, Indian shares rose for a fourth consecutive session as banks
FTSE
1.0
72
7,267
rebounded from recent string of losses and global cues remained well supported on
increased hopes that a full-blown war between the U.S. and China could be averted.
Nikkei
(0.2)
(44)
21,750
The BSE Sensex ended up by 0.3% at 33,880.
Hang Seng
0.5
161
30,890
Shanghai Com
0.5
16
3,207
News Analysis
Car sales in March marginally up, passenger vehicles rise 6.38%
Advances / Declines
BSE
NSE
Detailed analysis on Pg2
Advances
1,273
851
Investor’s Ready Reckoner
Declines
1,456
952
Unchanged
133
65
Key Domestic & Global Indicators
Stock Watch: Latest investment recommendations on 150+ stocks
Volumes (` Cr)
Refer Pg5 onwards
BSE
2,892
Top Picks
NSE
27,851
CMP
Target
Upside
Company
Sector
Rating
(`)
(`)
(%)
Blue Star
Capital Goods Accumulate
792
867
9.5
Net Inflows (` Cr)
Net
Mtd
Ytd
Dewan Housing Finance
Financials
Buy
535
720
34.6
FII
(1,285)
(1,023)
12,585
Century Plyboards
Forest Product Accumulate
350
400
14.3
*MFs
984
1,884
36,344
Navkar Corporation
Others
Buy
175
265
52.6
KEI Industries
Capital Goods Accumulate
435
470
8.0
More Top Picks on Pg4
Top Gainers
Price (`)
Chg (%)
Key Upcoming Events
TATASTEELPP
158
9.7
Previous
Consensus
BAJAJHIND
10
6.0
Date
Region
Event Description
ReadingExpectations
NILKAMAL
1,726
5.9
Apr 11, 2018 US
Consumer price index (mom)
0.20
-
Apr 11, 2018 US
Consumer Price Index (YoY)
2.90
2.60
PRAJIND
97
5.8
Apr 11, 2018 China
Industrial Production (YoY)
1.60
2.90
IIFL
785
5.7
Apr 12, 2018 UK
Initial Jobless claims
242.00
230.00
Apr 12, 2018 India
Exports YoY%
4.48
Top Losers
Price (`)
Chg (%)
More Events on Pg7
VAKRANGEE
155
-5.0
TRENT
353
-3.6
MGL
945
-3.5
SUNTECK
406
-2.9
IGL
295
-2.8
As on April 10, 2018
Market Outlook
April 11, 2018
News Analysis
Car sales in March marginally up, passenger vehicles rise 6.38%
Domestic passenger vehicle sales were up 6.38 per cent at 300,722 units in March
as against 282,698 units in the same month last year. Car sales were marginally
up at 191,082 units last month as against 190,236 units in March last year,
according to the data released by the Society of Indian Automobile Manufacturers
(SIAM) today. For the fiscal ended March 31, domestic passenger vehicles sales
were at 3,287,965 units as against 3,047,582 units in the previous year, up 7.89
per cent. Car sales for 2017-18 were at 2,173,950 units as against 2,103,847
units in 2016-17, a growth of 3.33 per cent. Total two-wheeler sales in FY18 stood
at 20,192,672 units as against 17,589,738 units in FY17, up 14.8 per cent.
Vehicle sales across categories registered 14.22 per cent growth at 24,972,788
units as against 21,863,281 units in the previous fiscal.
Economic and Political News
Indian Railways wagon procurement to run on reverse auction track
Inter-state e-way bill to be rolled out in five states from April 15
Power sourcing cost for industries in Odisha to rise in future
Corporate News
Honda two-wheeler unit eyes expansion with Rs 8-bn investment in FY19
Vedanta's request to renew copper smelter operations in Tamil Nadu
rejected
Swedish defence manufacturer Saab Group all set to make missiles in India
Mahindra Electric, Zoomcar tie up to offer self-drive EVs on rent in Delhi
Wipro's Rishad Premji replaces Raman Roy as Nasscom chairman for 2018-
19
Market Outlook
April 11, 2018
Top Picks
Market Cap
CMP
Target
Upside
Company
Rationale
(` Cr)
(`)
(`)
(%)
Strong growth in domestic business due to its
leadership in acute therapeutic segment. Alkem
Alkem Laboratories
21744
1,818
2,441
34.3
expects to launch more products in USA, which
bodes for its international business.
Favorable outlook for the AC industry to augur well
for Cooling products business which is out pacing
Blue Star
7,603
792
867
9.5
the market growth. EMPPAC division's profitability
to improve once operating environment turns
around.
With a focus on the low and medium income (LMI)
consumer segment, the company has increased its
Dewan Housing Finance
16,805
536
720
34.3
presence in tier-II & III cities where the growth
opportunity is immense.
Well capitalized with CAR of 18.1% which gives
sufficient room to grow asset base. Faster resolution
ICICI Bank
1,85,286
288
416
44.4
of NPA would reduce provision cost, which would
help to report better ROE.
High order book execution in EPC segment, rising
KEI Industries
3,405
435
470
8.0
B2C sales and higher exports to boost the revenues
and profitability
Expected to benefit from the lower capex
Music Broadcast Limited
2,231
391
475
21.5
requirement and 15 year long radio broadcast
licensing.
Massive capacity expansion along with rail
Navkar Corporation
2,634
175
265
51.4
advantage at ICD as well CFS augur well for the
company
Strong brands and distribution network would boost
Siyaram Silk Mills
3,458
738
851
15.3
growth going ahead. Stock currently trades at an
inexpensive valuation.
Market leadership in Hindi news genre and no. 2
viewership ranking in English news genre, exit from
TV Today Network
2,893
485
603
24.3
the radio business, and anticipated growth in ad
spends by corporate to benefit the stock.
After GST, the company is expected to see higher
volumes along with improving product mix. The
Maruti
2,79717
9,259
10,619
14.7
Gujarat plant will also enable higher operating
leverage which will be margin accretive.
We expect loan book to grow at 24.3% over next
GIC Housing
2,137
397
655
65.0
two year; change in borrowing mix will help in NIM
improvement
We expect CPIL to report net Revenue/PAT CAGR of
~17%/16% over FY2017-20E mainly due to
Century Plyboards
7,780
350
400
14.3
healthy growth in plywood & lamination business,
forayed into MDF & Particle boards on back of
strong brand & distribution network.
We expect sales/PAT to grow at 13.5%/20% over
LT Foods
3,102
97
128
32.0
next two years on the back of strong distribution
network & addition of new products in portfolio.
Third largest brand play in luggage segment
Increased product offerings and improving
Safari Industries
1,446
650
690
6.2
distribution network is leading to strong growth in
business. Likely to post robust growth for next 3-4
years
We expect HSIL to report PAT CAGR of ~15% over
FY2017-20E owing to better improvement in
HSIL Ltd
2,666
404
510
26.2
operating margin due price hike in container glass
segment, turnaround in consumer business.
We expect financialisation of savings and
Aditya Birla Capital
35161
160
230
43.7
increasing penetration in Insurance & Mutual fund
would ensure steady growth.
Source: Company, Angel Research
Market Outlook
April 11, 2018
Fundamental Call
Market Cap
CMP
Target
Upside
Company
Rationale
(` Cr)
(`)
(`)
(%)
CCL is likely to maintain the strong growth trajectory
CCL Products
3,831
288
360
25.0
over FY18-20 backed by capacity expansion and new
geographical foray
We forecast Nilkamal to report top-line CAGR of ~9%
to `2,635cr over FY17-20E on the back of healthy
Nilkamal
2,576
1,726
2,178
26.2
demand growth in plastic division. On the bottom-line
front, we estimate ~10% CAGR to `162cr owing to
improvement in volumes.
The prism has diversified exposure in the different
segment such as Cement, Tile & ready mix concrete.
Prism Cement
5,939
118
160
35.6
Thus we believe, PCL is in the right place to capture
ongoing government spending on affordable housing
and infrastructure projects.
Elantas Beck India is the Indian market leader in liquid
insulation segment used in electrical equipments like
Elantas Beck India Ltd
1,740
2,196
2,500
13.9
motors, transformers etc. It derives demand from
several industries which are expected to register 10%+
CAGR in demand in the coming years.
Greenply Industries Ltd (GIL) manufactures plywood &
allied products and medium density fibreboards
(MDF). GIL to report net revenue CAGR of ~14% to
Greenply Industries
3,891
317
395
24.6
~`2,478cr over FY2017-20E mainly due to healthy
growth in plywood & lamination business on the back
of strong brand and distribution network
Ashok Leyland Ltd (ALL) is the flagship company of the
Hinduja Group, and one of the largest commercial
vehicle manufacturers in India. Ashok Leyland
Ashok Leyland
42,530
145
163
12.4
expected to report net Profit (reported) CAGR of ~19%
to
~`2,075cr over FY2017-20E mainly due to
improvement in replacement demand.
Source: Company, Angel Research
Market Outlook
April 11, 2018
Key Upcoming Events
Global economic events release calendar
Bloomberg Data
Date
Time Country
Event Description
Unit
Period
Last Reported
Estimated
Apr 11, 2018
6:00 PMUS
Consumer price index (mom)
% Change
Mar
0.20
-
7:00 AMChina
Consumer Price Index (YoY)
% Change
Mar
2.90
2.60
2:00 PMUK
Industrial Production (YoY)
% Change
Feb
1.60
2.90
Apr 12, 2018
6:00 PMUS
Initial Jobless claims
Thousands
Apr 7
242.00
230.00
India
Exports YoY%
% Change
Mar
4.48
Apr 13, 2018
5:30 PMIndia
Industrial Production YoY
% Change
Feb
7.50
6.90
India
Imports YoY%
% Change
Mar
10.41
China
Exports YoY%
% Change
Mar
44.50
11.80
Apr 16, 2018
12:00 PMIndia
Monthly Wholesale Prices YoY%
% Change
Mar
2.48
2.65
Apr 17, 2018
2:00 PMUK
Jobless claims change
% Change
Mar
9.20
6:45 PMUS
Industrial Production
%
Mar
0.95
0.30
6:00 PMUS
Housing Starts
Thousands
Mar
1,236.00
1,260.00
6:00 PMUS
Building permits
Thousands
Mar
1,321.00
1,320.00
7:30 AMChina
Industrial Production (YoY)
% Change
Mar
6.20
6.40
7:30 AMChina
Real GDP (YoY)
% Change
1Q
6.80
6.80
Apr 18, 2018
2:00 PMUK
CPI (YoY)
% Change
Mar
2.70
7:30 PMEuro Zone
Euro-Zone Consumer Confidence
Value
Apr A
0.10
Apr 20, 2018
2:30 PMEuro Zone
Euro-Zone CPI (YoY)
%
Mar F
1.40
Apr 23, 2018
1:00 PMGermany
PMI Services
Value
Apr P
53.90
1:00 PMGermany
PMI Manufacturing
Value
Apr P
58.20
7:30 PMUS
Existing home sales
Million
Mar
5.54
Apr 24, 2018
7:30 PMUS
Consumer Confidence
S.A./ 1985=100
Apr
127.70
7:30 PMUS
New home sales
Thousands
Mar
618.00
Source: Bloomberg, Angel Research
Market Outlook
April 11, 2018
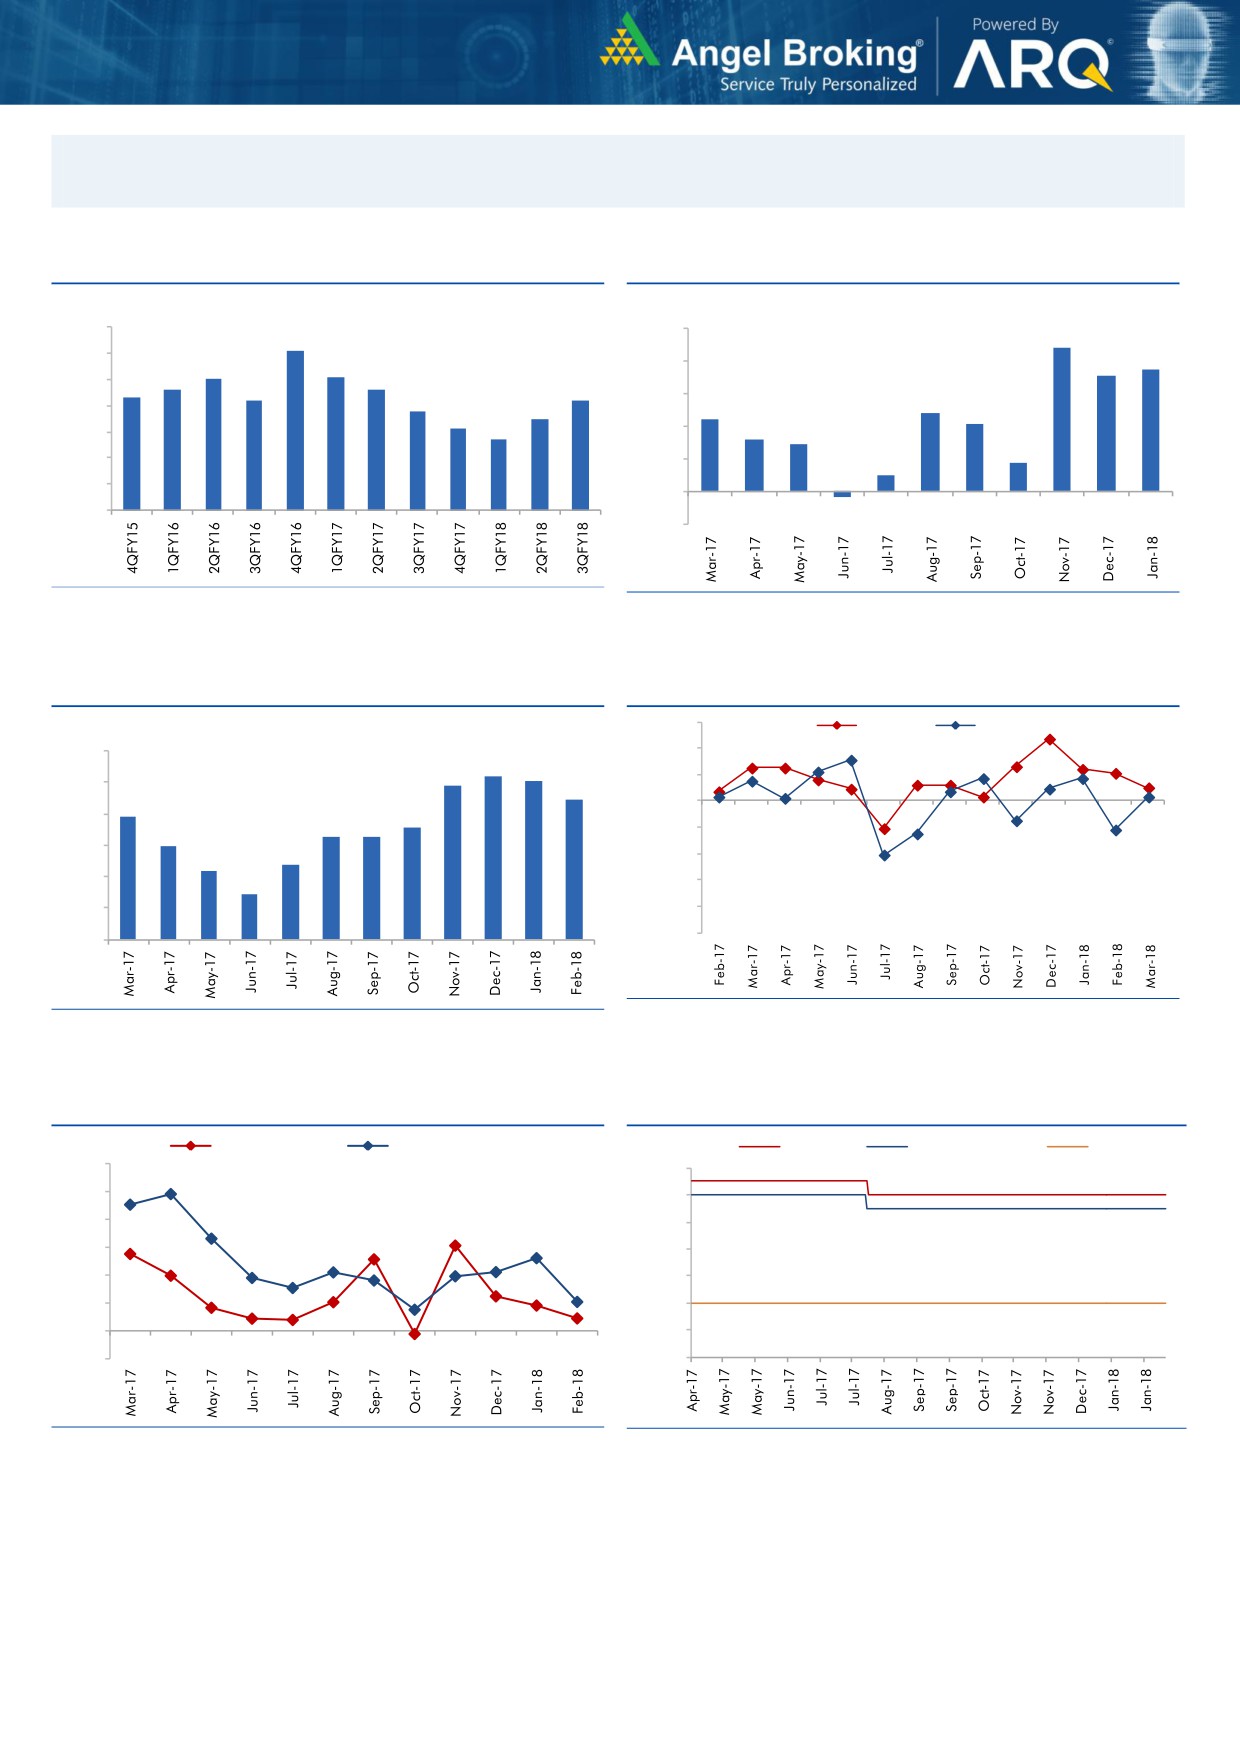
Macro watch
Exhibit 1: Quarterly GDP trends
Exhibit 2: IIP trends
(%)
(%)
10.0
10.0
9.1
8.8
9.0
7.5
8.0
8.1
8.0
7.1
7.6
7.6
8.0
7.3
7.2
7.2
6.8
6.0
4.8
7.0
6.5
4.4
6.1
4.1
5.7
4.0
3.2
2.9
6.0
1.8
5.0
2.0
1.0
4.0
-
3.0
(0.3)
(2.0)
Source: CSO, Angel Research
Source: MOSPI, Angel Research
Exhibit 3: Monthly CPI inflation trends
Exhibit 4: Manufacturing and services PMI
56.0
Mfg. PMI
Services PMI
(%)
6.0
54.0
5.2
5.1
4.9
52.0
5.0
4.4
3.9
50.0
4.0
3.6
3.3
3.3
3.0
48.0
3.0
2.4
2.2
46.0
2.0
1.5
44.0
1.0
42.0
40.0
-
Source: Market, Angel Research; Note: Level above 50 indicates expansion
Source: MOSPI, Angel Research
Exhibit 5: Exports and imports growth trends
Exhibit 6: Key policy rates
(%)
Exports yoy growth
Imports yoy growth
(%)
Repo rate
Reverse Repo rate
CRR
60.0
6.50
50.0
6.00
40.0
5.50
30.0
5.00
20.0
4.50
10.0
4.00
0.0
3.50
(10.0)
3.00
Source: Bloomberg, Angel Research
Source: RBI, Angel Research
Market Outlook
April 11, 2018
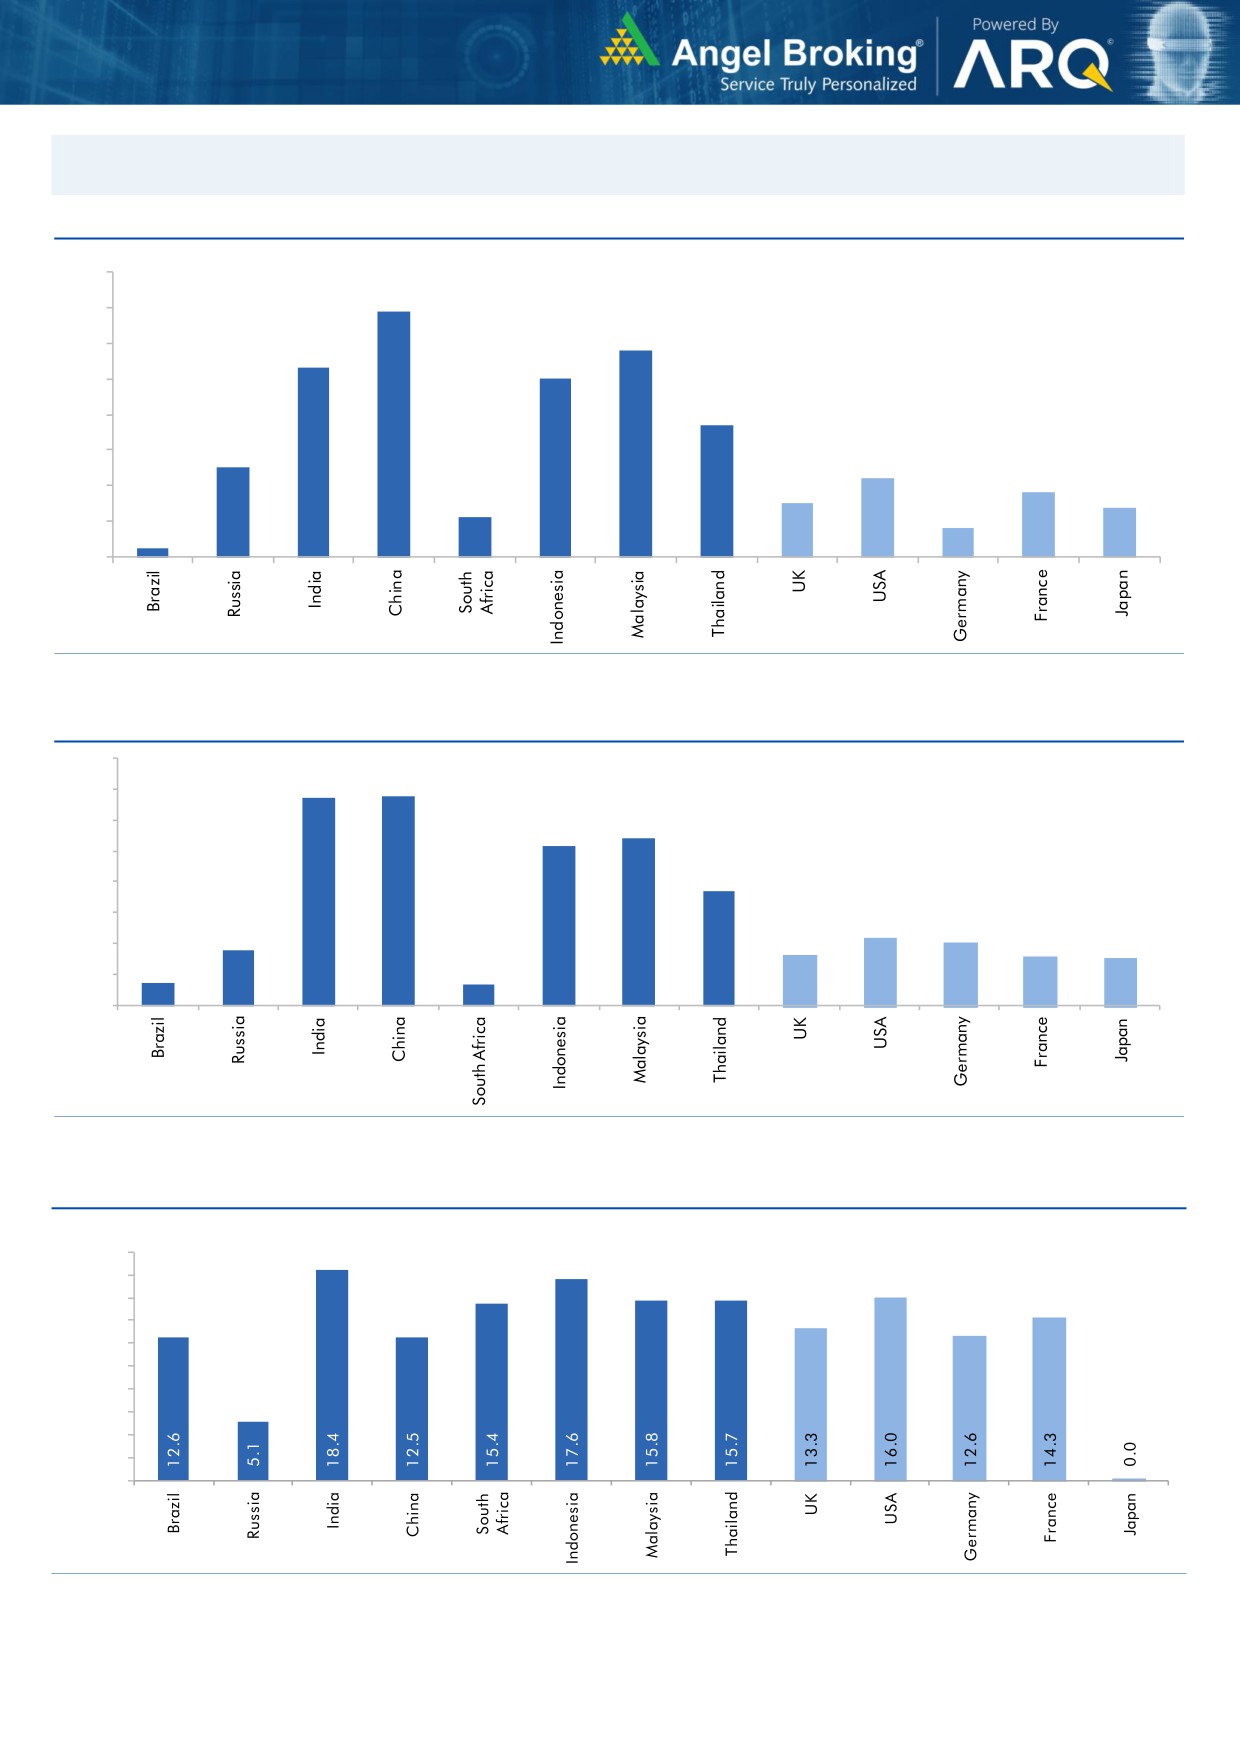
Global watch
Exhibit 1: Latest quarterly GDP Growth (%, yoy) across select developing and developed countries
(%)
8.0
6.9
7.0
5.8
6.0
5.3
5.0
5.0
1.1
3.7
4.0
2.5
3.0
2.2
1.8
2.0
1.5
1.4
0.8
1.0
0.3
-
Source: Bloomberg, Angel Research
Exhibit 2: 2017 GDP Growth projection by IMF (%, yoy) across select developing and developed countries
(%)
6.7
6.8
7.0
6.0
5.4
5.2
5.0
3.7
4.0
3.0
1.8
2.2
2.0
1.7
1.6
2.0
0.7
1.5
0.7
1.0
-
Source: IMF, Angel Research
Exhibit 3: One year forward P-E ratio across select developing and developed countries
(x)
20.0
18.0
16.0
14.0
12.0
10.0
8.0
6.0
4.0
2.0
-
Source: IMF, Angel Research
Market Outlook
April 11, 2018
Exhibit 4: Relative performance of indices across globe
Returns (%)
Country
Name of index
Closing price
1M
3M
1YR
Brazil
Bovespa
84,510
(0.6)
7.5
30.0
Russia
Micex
4,179
1.4
7.1
11.4
India
Nifty
10,402
2.4
(0.4)
12.3
China
Shanghai Composite
3,190
(2.5)
(4.2)
(0.1)
South Africa
Top 40
50,036
(4.3)
(5.3)
8.4
Mexico
Mexbol
48,332
0.9
(2.8)
(1.4)
Indonesia
LQ45
1,040
(1.7)
(3.4)
13.0
Malaysia
KLCI
1,861
0.9
2.4
6.9
Thailand
SET 50
1,165
(0.4)
0.1
16.3
USA
Dow Jones
24,408
(2.0)
(3.5)
18.2
UK
FTSE
7,267
1.5
(5.6)
(1.1)
Japan
Nikkei
21,794
2.0
(8.1)
14.8
Germany
DAX
12,397
1.2
(7.3)
1.4
France
CAC
5,308
2.3
(3.3)
4.0
Source: Bloomberg, Angel Research p68in4